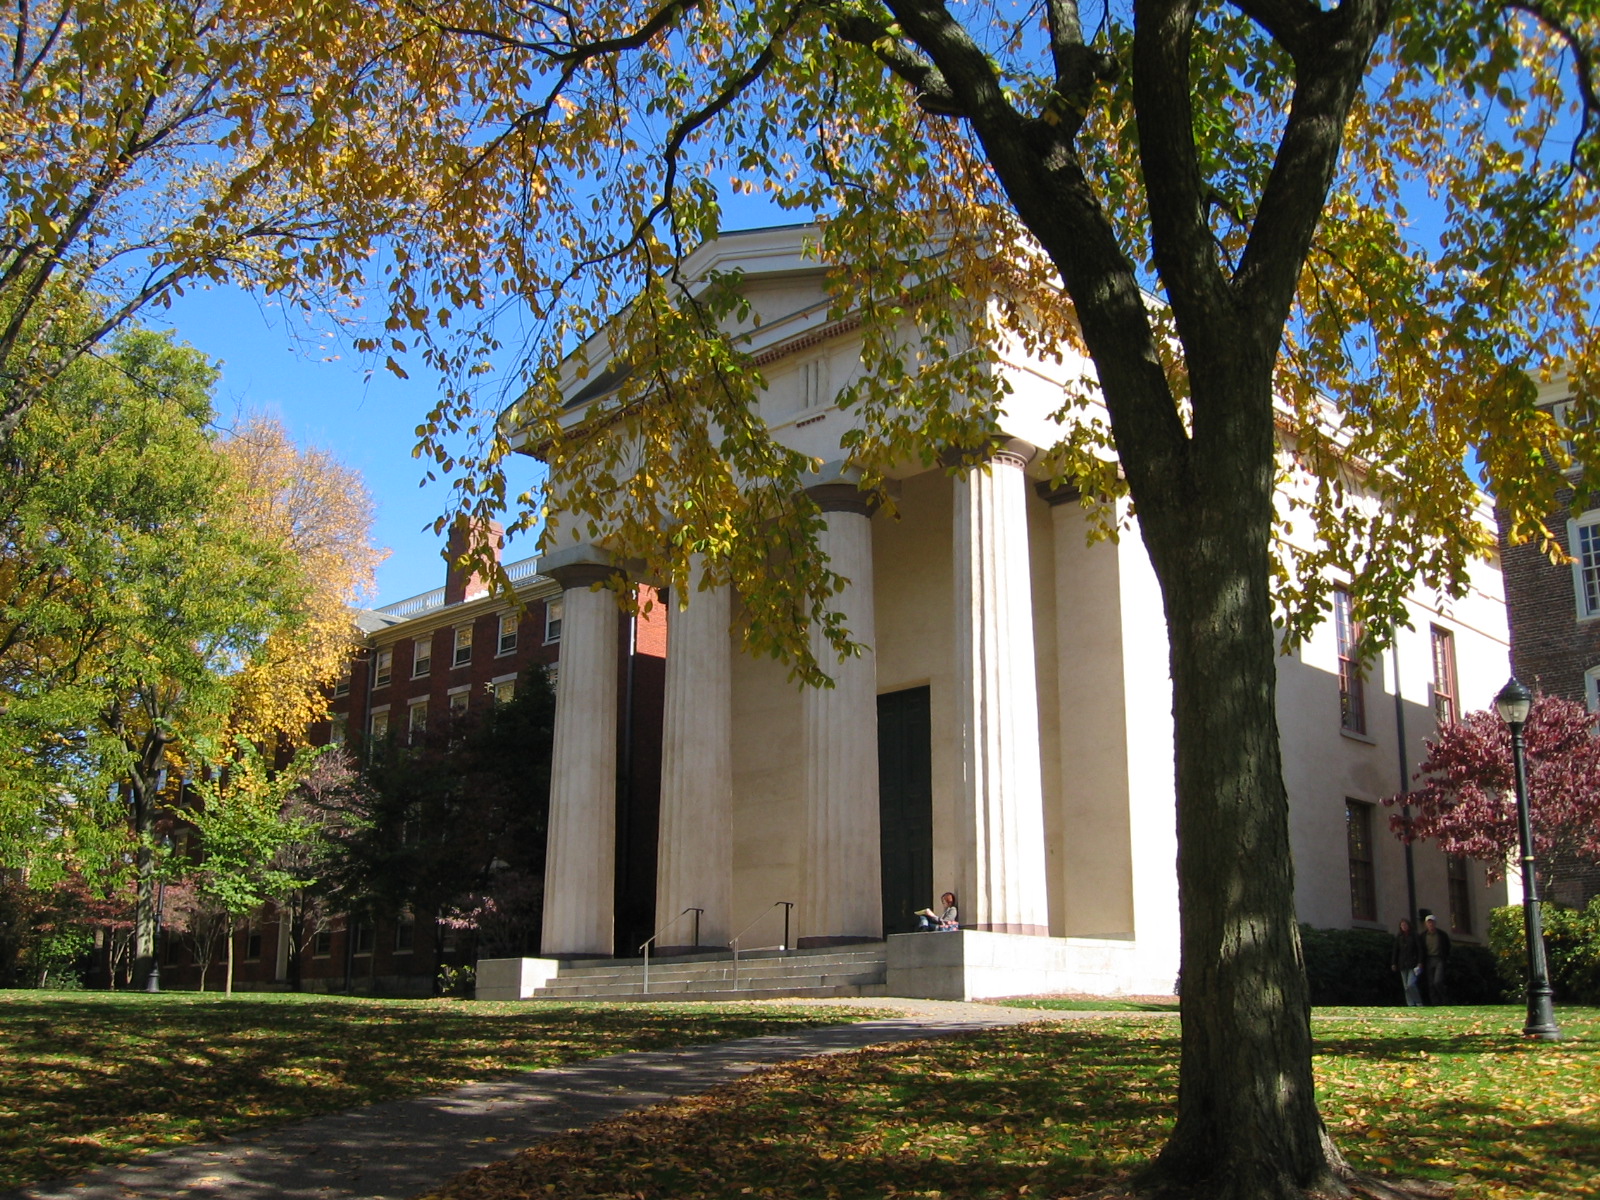
National university
#11 Best colleges in AmericaBrown University
Providence, RI · Private nonprofit · 4-year
Your real cost
Average price after aid $25,184 a year
Median debt at graduation: $11,428 (all students)
Estimate your own price · the college’s net price calculator
Rankings
Where this college places on our top lists. Lists are worked out from official data and our own research; places in the top quarter of each list are shown. See every list
In America
- Best colleges for education in America#2 of 1,318
- Best colleges for business in America#5 of 1,563
- Best colleges for communications and journalism in America#4 of 1,238
- Best colleges for psychology in America#8 of 1,418
- Best colleges for biology and pre-med in America#8 of 1,358
- Best colleges in America#11 of 1,829
Show 25 more
- Best colleges for art and design in America#8 of 1,187
- Best test-optional colleges in America#10 of 1,481
- Best colleges for English in America#10 of 1,283
- Best colleges for history in America#10 of 1,247
- Best colleges for mathematics in America#10 of 1,215
- Best colleges for chemistry in America#10 of 1,162
- Best colleges for political science and pre-law in America#10 of 1,116
- Best colleges for computer science in America#7 of 750
- Best colleges for music in America#10 of 1,063
- Best colleges for engineering in America#9 of 749
- Best colleges for economics in America#10 of 788
- Best mid-size colleges in America#9 of 667
- Best colleges for NCAA Division I athletes in America#5 of 367
- Colleges with the highest graduation rates in America#25 of 1,829
- Most selective colleges in America#11 of 683
- Colleges with the lowest student debt in America#15 of 684
- Colleges with the most faculty per student in America#21 of 704
- Colleges with the biggest discount off the sticker price in America#21 of 690
- Colleges where the most freshmen return in America#22 of 693
- Lowest net price for middle-income families in America#23 of 682
- Colleges that spend the most on teaching in America#27 of 704
- Best value colleges in the Northeast in America#20 of 239
- Colleges that pay for themselves fastest in America#55 of 598
- Best value colleges in America#69 of 674
- Colleges with the best earnings for the price in America#109 of 681
In Rhode Island
- Best colleges in Rhode Island#1 of 11
- Best test-optional colleges in Rhode Island#1 of 11
- Colleges with the highest graduation rates in Rhode Island#1 of 11
- Best colleges for business in Rhode Island#1 of 10
- Best colleges for art and design in Rhode Island#1 of 9
- Best colleges for communications and journalism in Rhode Island#1 of 9
Show 16 more
- Best colleges for political science and pre-law in Rhode Island#1 of 9
- Best colleges for psychology in Rhode Island#1 of 9
- Best value colleges in Rhode Island#1 of 9
- Best value colleges in the Northeast in Rhode Island#1 of 9
- Colleges with the best earnings for the price in Rhode Island#1 of 9
- Colleges with the biggest discount off the sticker price in Rhode Island#1 of 9
- Colleges where the most freshmen return in Rhode Island#1 of 9
- Colleges with the lowest student debt in Rhode Island#1 of 9
- Lowest net price for middle-income families in Rhode Island#1 of 9
- Colleges that spend the most on teaching in Rhode Island#1 of 9
- Colleges with the most faculty per student in Rhode Island#1 of 9
- Most selective colleges in Rhode Island#1 of 9
- Best colleges for biology and pre-med in Rhode Island#1 of 8
- Best mid-size colleges in Rhode Island#1 of 8
- Colleges that pay for themselves fastest in Rhode Island#1 of 8
- Most affordable colleges with strong academics in Rhode Island#2 of 9
Academic Excellence
Each measure counts for the share shown.
- Graduation rate 35% of scoreThis measure counts for 35% of the Academic Excellence score.96%
- First-year retention 20% of scoreThis measure counts for 20% of the Academic Excellence score.99%
- Entering students' test scores 15% of scoreThis measure counts for 15% of the Academic Excellence score.SAT 1,546 · ACT 34.5
- Student-to-faculty ratio 15% of scoreThis measure counts for 15% of the Academic Excellence score.6 to 1
- Instructional spending per student 15% of scoreThis measure counts for 15% of the Academic Excellence score.$42,520
Bars show points on each measure’s scale. How Academic Excellence is computed.
Source: College Scorecard (College Scorecard, most recent cohorts (data release 06/10/2026))
What families pay, by income
Average yearly price after grants and scholarships, for students who receive federal aid.
| Family income | Price after aid |
|---|---|
| Up to $30,000 | |
| $30,001–$48,000 | |
| $48,001–$75,000 | |
| $75,001–$110,000 | |
| Over $110,000 |
Full cost of attendance before aid: $87,648 a year.
Use the college’s net price calculator for your own estimate.
Cost and value
Federal data: what families pay after aid, what graduates earn, and what they owe.
| Undergraduate students Fall enrollment (IPEDS) | 7,741 |
|---|---|
| Men and women Undergraduates, fall 2023 (College Scorecard) | Men 50% · Women 50% |
| First-generation students Share of students who are first-generation, by the College Scorecard’s definition | 17% |
| First-year students from another state Of first-time students whose home is a U.S. state, fall 2023 (IPEDS) | 96% |
| Total students | 11,516 |
| Average net price (per year) After grants and scholarships, for students receiving federal aid | $25,184 |
| Cost of attendance (per year) | $87,648 |
| Median federal debt at graduation | $11,428 |
| Graduation rate First-time, full-time students finishing within 150% of normal time | 96% |
| Graduation rate for Pell grant recipients Finishing within 6 years (College Scorecard) | 92% |
| Graduation rate for first-generation students Finishing within 6 years (College Scorecard) | 93% |
| Borrowers paying down their loans within 3 years Borrowers who repaid at least $1 of principal within 3 years (College Scorecard) | 87% |
| First-year retention | 99% |
| Median earnings 10 years after entry | $93,487 |
| Admission rate | 5% |
| Application fee Undergraduate application fee, 2023–24 (IPEDS) | $75 |
| Students receiving Pell grants | 14% |
| Average SAT | 1546 |
|---|---|
| SAT reading & writing | 740–780 |
| SAT math | 770–800 |
| ACT composite | 34–35 |
| Test policy | Considered but not required |
Value: Exceptional · Top 9% (how it’s computed)
Sources: College Scorecard · IPEDS College Navigator · Net price calculator
College Scorecard, most recent cohorts (data release 06/10/2026); IPEDS 2024-25 directory and institutional characteristics; fall 2023 enrollment.
Earnings by major
Median earnings of bachelor’s graduates a few years after finishing, by major (College Scorecard).
| Major | Median earnings |
|---|---|
| Computer science | |
| Applied mathematics | |
| Entrepreneurship | |
| Economics | |
| Engineering (general) | |
| Public Policy Analysis | |
| Biomedical/Medical Engineering | |
| International relations | |
| History | |
| Political science | |
| Public health | |
| Urban Studies/Affairs | |
| English | |
| Human Biology | |
| Experimental psychology | |
| Fine arts | |
| Biology | |
| Area studies |
Also offered (no earnings published yet): Anthropology, Archeology, Architecture, Astronomy and Astrophysics, Behavioral Sciences, Biochemistry, Biomathematics, Bioinformatics, and Computational Biology, Chemistry, Classical and Ancient Studies, Classics, Cognitive Science, Communication studies, Computing and information science, Ecology and evolutionary biology, Education (general), Engineering Physics, Ethnic and gender studies, General studies, Geology and earth science, Human resources, Interdisciplinary studies, Liberal arts, Linguistics, Mathematics, Medieval and Renaissance Studies, Music, Natural resources and conservation, Neuroscience, Other engineering, Other social sciences, Philosophy, Physics, Psychology, Religious studies, Romance languages, Science, Technology and Society, Social sciences, Sociology, Statistics, Theatre, Writing and rhetoric.
What students study most
Share of bachelor’s degrees by field, first majors in 2023–24 (IPEDS).
| Field | Share of degrees |
|---|---|
| Social sciences | |
| Computer and information sciences | |
| Biology | |
| Mathematics and statistics | |
| Interdisciplinary studies |
Campus life
| Setting | City |
|---|---|
| Part-time undergraduates | 1% |
| Undergraduates aged 25 and older | 2% |
| On-campus room and board (per year) | $17,444 |
| Sports | NCAA Division I · Ivy Group |
| ROTC | Army · Navy · Air Force |
| Study abroad | Offered |
| Students per faculty member | 6 to 1 |
| Faculty who are full-time | 92%Of instructional faculty, fall 2023 (College Scorecard) |
| Endowment per student | $558,738Endowment at the end of fiscal year 2023, per full-time-equivalent student (IPEDS) |
| Dorm space | For about 69% of studentsCampus beds divided by undergraduate enrollment. Not how many students live on campus (IPEDS) |
| Nearest airport with scheduled flights | Rhode Island T. F. Green International Airport (PVD)About 7 miles away in a straight line (OurAirports) |
| Town population | 191,7672020–2024 five-year estimate (U.S. Census Bureau) |
| Nearest city of 250,000 people or more | BostonAbout 41 miles away in a straight line (U.S. Census Bureau) |
| Average temperature in January | 30°F1991–2020 normal, from PROVIDENCE T F GREEN AP, RI US, about 7 miles away (NOAA) |
| Average temperature in July | 74°F1991–2020 normal, from PROVIDENCE T F GREEN AP, RI US, about 7 miles away (NOAA) |
Federal data (IPEDS and College Scorecard).
Campus safety reports
On-campus crimes reported in 2024, per 1,000 students.
| Category | This campus | U.S. rate |
|---|---|---|
| Rape | 0.84 | 0.07 |
| Robbery | 0.00 | 0.01 |
| Aggravated assault | 0.08 | 0.04 |
| Burglary | 0.59 | 0.08 |
| Motor vehicle theft | 1.84 | 0.15 |
Numbers reflect what each campus reported. They differ with campus size and how reporting is done, so compare with care. U.S. rate: total reported offenses divided by total students at every institution in the report.
Questions families ask
- What is Brown University’s Compass Score?
- Exceptional (grade A+). It ranks in the top 1% of rated colleges. The grade comes from outcomes (40%: graduation, retention and earnings), entering students (40%: test scores and selectivity), cost (15%: debt and price after aid) and teaching (5%: class size), all from federal data.
- How much does Brown University cost after financial aid?
- The average net price is $25,184 a year for students who receive federal aid, after grants and scholarships. What your family pays depends on income; the college’s net price calculator gives your own estimate.
- How hard is it to get into Brown University?
- Brown University admitted 5% of applicants in the most recent federal data.
- How do Brown University’s graduates do?
- 96% of first-time, full-time students graduate within six years; the median earnings of former students ten years after entry are $93,487; the median federal debt at graduation is $11,428.
Ask the school
Something you want to know that isn’t on this page? Ask it here. We send it to the school, and their answer appears on this page. Your name is never shared.
Reviews
Personal experiences from signed-in readers. Reviews are moderated automatically and never change a school’s grades.
No reviews yet.
Sign in to write a review.
My rating and notes
Sign in or create a free account to rate this school privately, keep notes, and save it to your list.
About this school’s data
- IPEDS unit ID 217156
- Carnegie classification: Doctoral university (very high research)
- Accreditation: New England Commission of Higher Education (U.S. Department of Education DAPIP)
- Report an error or a newer source
- Respond as this school
Colleges like this one
The same kind of school first, then the closest in selectivity, size and cost.
Compare side by side: Brown vs Yale · Brown vs Massachusetts Institute of Technology · Brown vs Duke · Brown vs Vanderbilt
More in Rhode Island · Rhode Island rankings